The trading relationship among Canada, the largest partner U.S.A., and the American's 2 biggest Asian partners, China & Japan
updated 2010 Sept 14

| Canada's "Trading
Square"
The trading relationship among Canada, the largest partner U.S.A., and the American's 2 biggest Asian partners, China & Japan updated 2010 Sept 14 |
|
| UPDATE
2012 May |
China -
Canada
2 way trade 1997 $ 8 billion 2010 $ 60 billion 2012 $ 70 billion In 2012 Canadian
exports to China
largest category of imports
from China was electrical machinery and equipment - as this has been the
predominant category for several years
|
| UPDATE
2010 May |
China -
Canada
2 way trade 1997 $ 8 billion 2010 $ 60 billion Mandy Y in MGTC44 at UTSC
in early May 2010 emailed to say that she found a site
"China replaced Japan as
Canada's third largest country of destination,
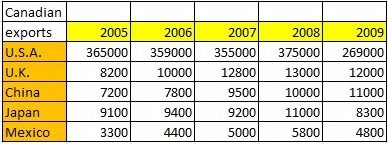
"In 2009, the United States represented 63.0% of Canada's total merchandise trade (exports and imports combined), down from 65.7% in 2008 and 71.1% in 2005. Exports to the United States declined 28.2% to $269.5 billion, led by falling prices of energy products and lower demand for automotive products." |
| Canada's
Export Destinations |
based on the
info at http://www.statcan.gc.ca/daily-quotidien/100406/dq100406a-eng.htm
 |
| Canada's
Export Destinations |
based on the
chart above, WTGR created a line chart to see the relationships
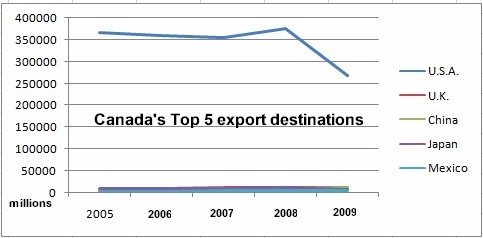 |
| Canada's
Export Destinations |
due to the very
large number for exports to the USA, a graphical representation looks poor
because the UK, China, Japan and Mexico figures are collapsed at the bottom.
Below is a rendition easier to view.
(WTGR) 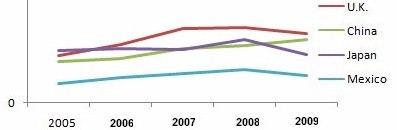
interesting to note that despite the USA importing less, which means Chinese companies have less customers, Canadian exports to China still rose in 2009 |
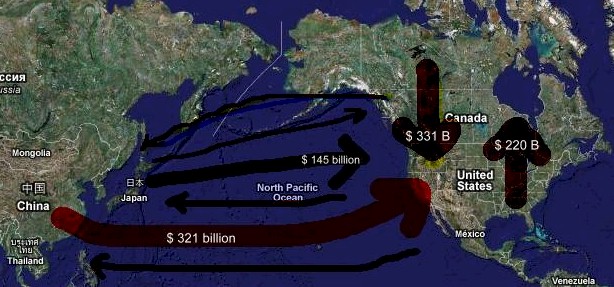
Canada - U.S.A. - China -
Japan (2007)
,
| Canadian
exports to the U.S.
Canadian imports from the U.S. Canadian exports
to Japan
U.S. exports to Japan
|
$
331 billion
$ 220 billion $ 9
billion
$ 62 billion
|
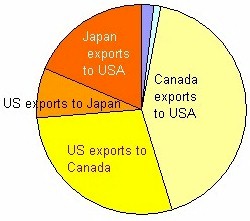
$ 782 billion total value of Canada - U.S. - Japan trade |
| Canadian
exports to the U.S.
Canadian imports from the U.S. Canadian exports
to China
U.S. exports to China
|
$
331 billion
$ 220 billion $
7 billion
$ 65 billion
|
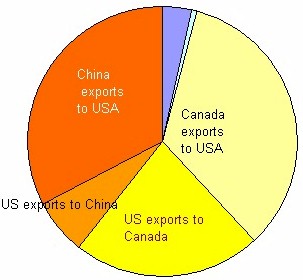
$ 978 billion total value of Canada - U.S. - China trade |
Canada - Japan - China
$
9 billion Canadian exports
to Japan
$ 15 billion
Canadian imports from Japan
$
7 billion Canadian exports
to China
$ 34 billion
Canadian imports from China
| Points
to observe from these
pie charts |
1. Canada exports
more to the U.S. than China
2. Canada's biggest export market in Asia is Japan 3. Canada imports "twice" as much from China, as from Japan 4. Canada is still the biggest export market for U.S. goods 5. The U.S. has a massive trade deficit with China - however a lot of this is U.S. based companies operating in China, exporting back tot he U.S. (eg. Walmart) |
Prof. Tim Richardson
sources
http://www.ic.gc.ca/epic/site/ibi-iai.nsf/en/h_bi18602e.html
http://www.ic.gc.ca/epic/site/ibi-iai.nsf/en/bi18683e.html
http://www.census.gov/foreign-trade/balance/c5700.html
..
|
|
CONTACT I MAIN PAGE I NEWS GALLERY I E-BIZ SHORTCUTS I INT'L BIZ SHORTCUTS I MKTG?BUSINESS SHORTCUTS I TEACHING SCHEDULE |
| . | |
| MISTAKES ITEXTS USED I IMAGES I RANK IDISCLAIMER I STUDENT CONTRIBUTORS I FORMER STUDENTS I | |
| . |